HOW IT WORKS

Multi-factor investing, built systematically.

QuantAscent helps you research factors, build systematic strategies, test them against historical market data, and deploy them through a structured investment workflow — without writing code.

Start Building
Strategy Engine Diagram — Reference Build
Factors
Quality
Momentum
Value
Volatility
Fin. Strength
Strategy Engine
Strategy
Engine
Analytics
Ranked Stocks
Annual Return
Sharpe Ratio
Max Drawdown
FUNDAMENTALS

What is a factor?

A factor is a measurable characteristic that has historically been associated with differences in stock returns. Think of them as lenses — each one highlights something different about a company.

Factors are structured investment signals built from real financial and market data — helping investors make decisions systematically instead of emotionally.

Grounded in academic finance research spanning 40+ years
Used by institutional investors and quant funds worldwide
Each factor can be weighted, combined, and tested
Quality

Companies that convert capital into profit efficiently, with historically steadier earnings.

ROIC · GP/A · Debt/Eq
Momentum

Stocks whose prices have trended upward over the past year, excluding the most recent month.

12–1M Return · % of 52W High · Dist. from 200D MA
Value

Companies trading at a low price relative to their earnings, cash flow, or book value.

FCF Yield · Earnings Yield · EV/EBITDA
Financial Strength

Companies carrying manageable debt with enough cash flow and liquidity to cover it.

Altman Z · Interest Coverage · Debt/Eq
Volatility

Stocks whose prices have moved in a narrower range than the broad market.

Realized Vol · Downside Vol · Beta
SIGNAL COMBINATION

Why combine factors?

Each factor has periods where it underperforms. Combining uncorrelated signals can reduce that fragility without simply averaging returns away.

01

Reduce factor-specific risk

Value struggled for a decade. Momentum reversed sharply in 2009. A single bet on either was painful. Combining them smooths the ride.

02

Factors are complementary

Quality and Momentum tend to diverge. Low Volatility holds up in downturns. These differences can work in your favor when weighted correctly.

03

More consistent signal selection

Multi-factor screens pick stocks that score well across several dimensions — not just cheap, but cheap and high quality.

CONNECTED WORKFLOWS

Research, build, test, and run systematic investment strategies.

Research

Metric Explorer

Analyze 120+ metrics using historical performance data, quintile breakdowns, and signal rankings to identify which factors belong in your strategy.

Historical statistical output, shown to illustrate the software. A metric's past relationship to subsequent returns may not persist, and does not predict the return of any individual stock.

Build

Strategy Builder

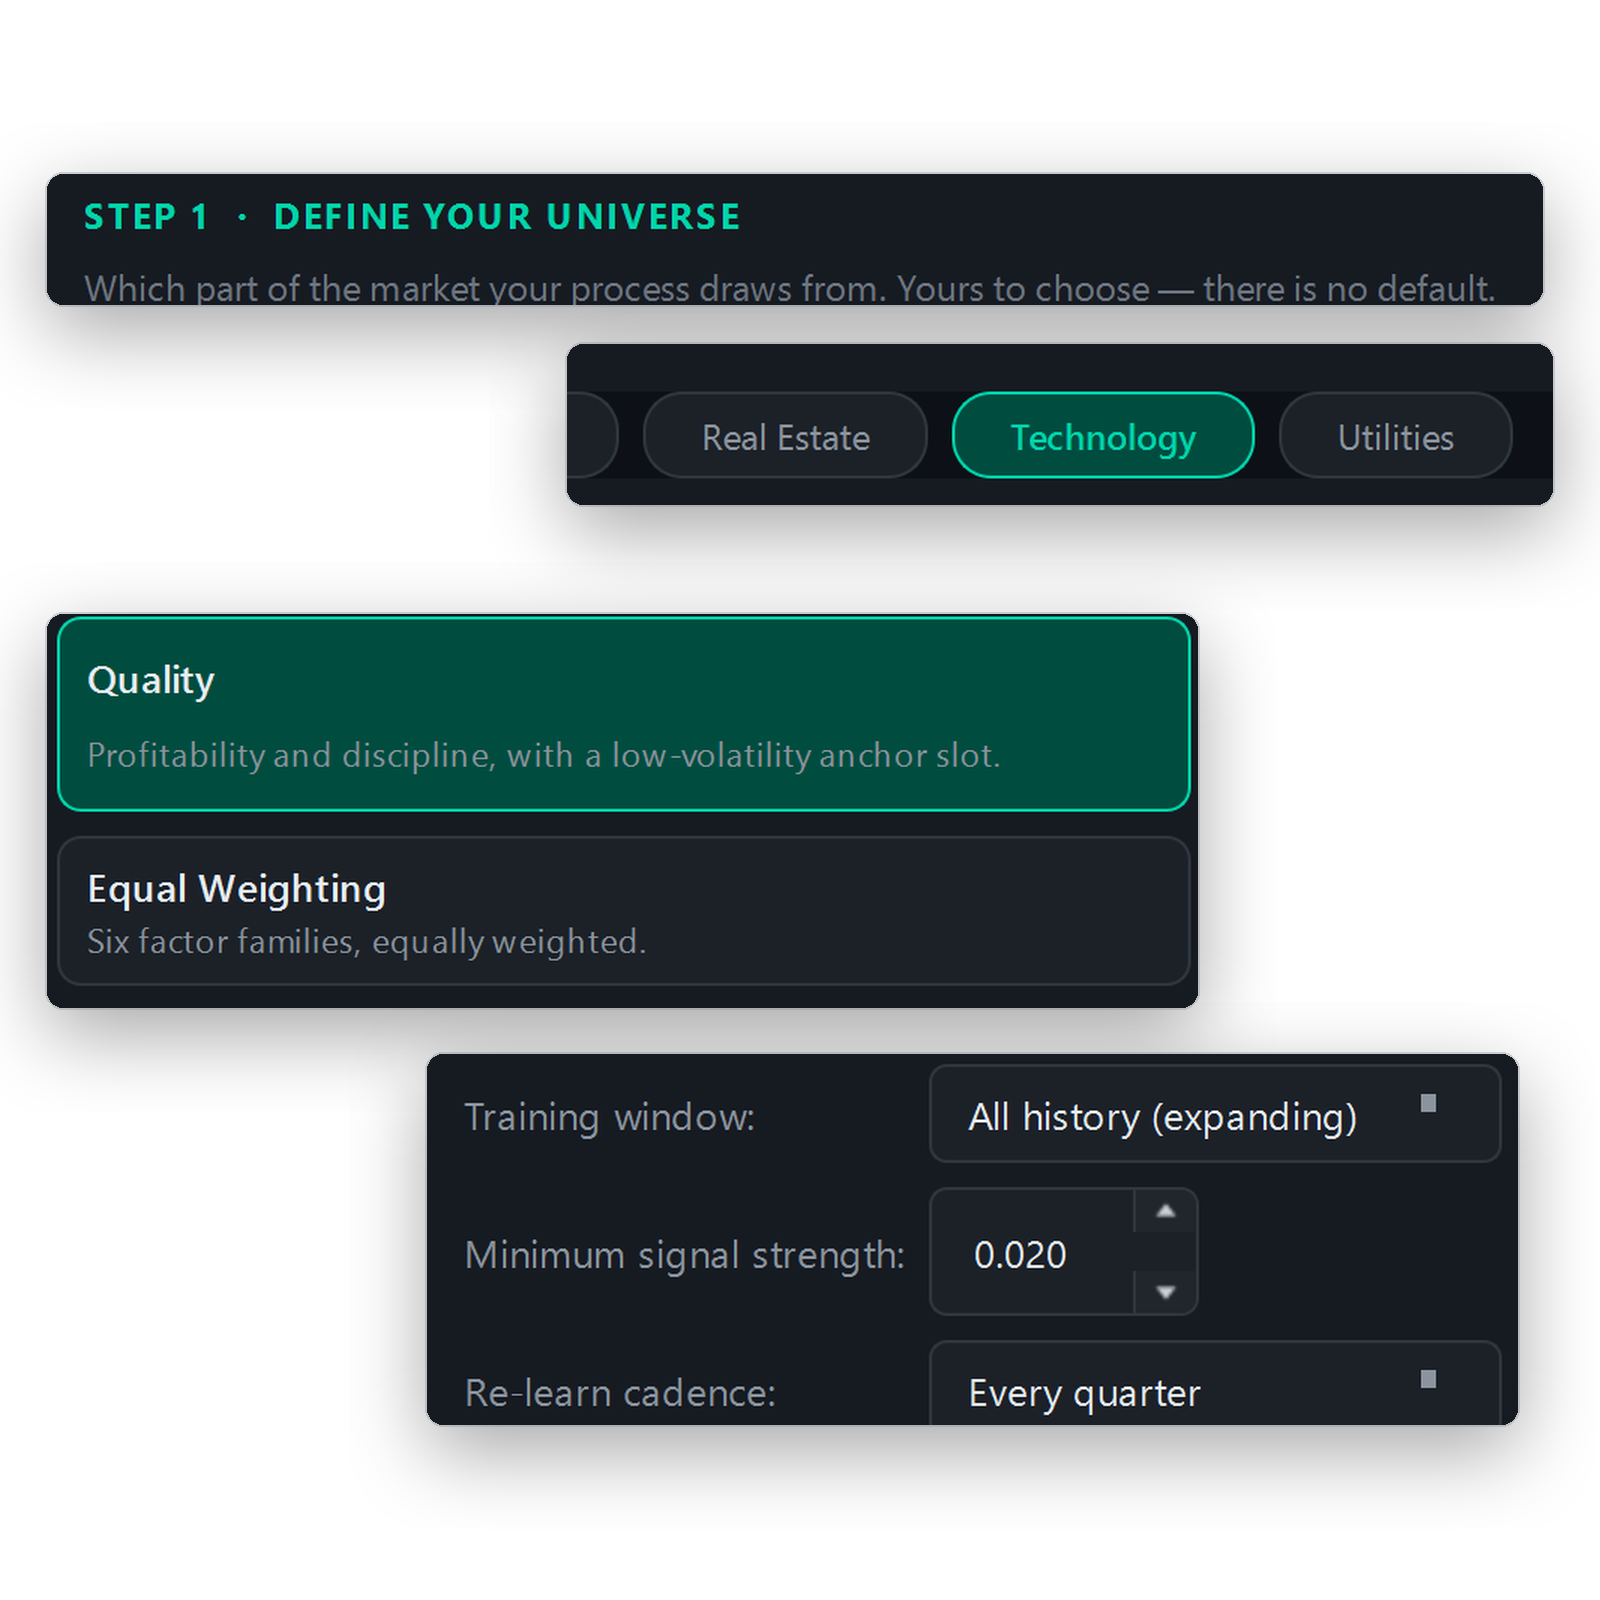
Stack factor cards, weight them, and layer filters—no code, just rules. Save versions, branch to test variants, and choose what to backtest next.

QuantAscent application screenshot. Values shown are for illustration.

Backtest

Performance Report

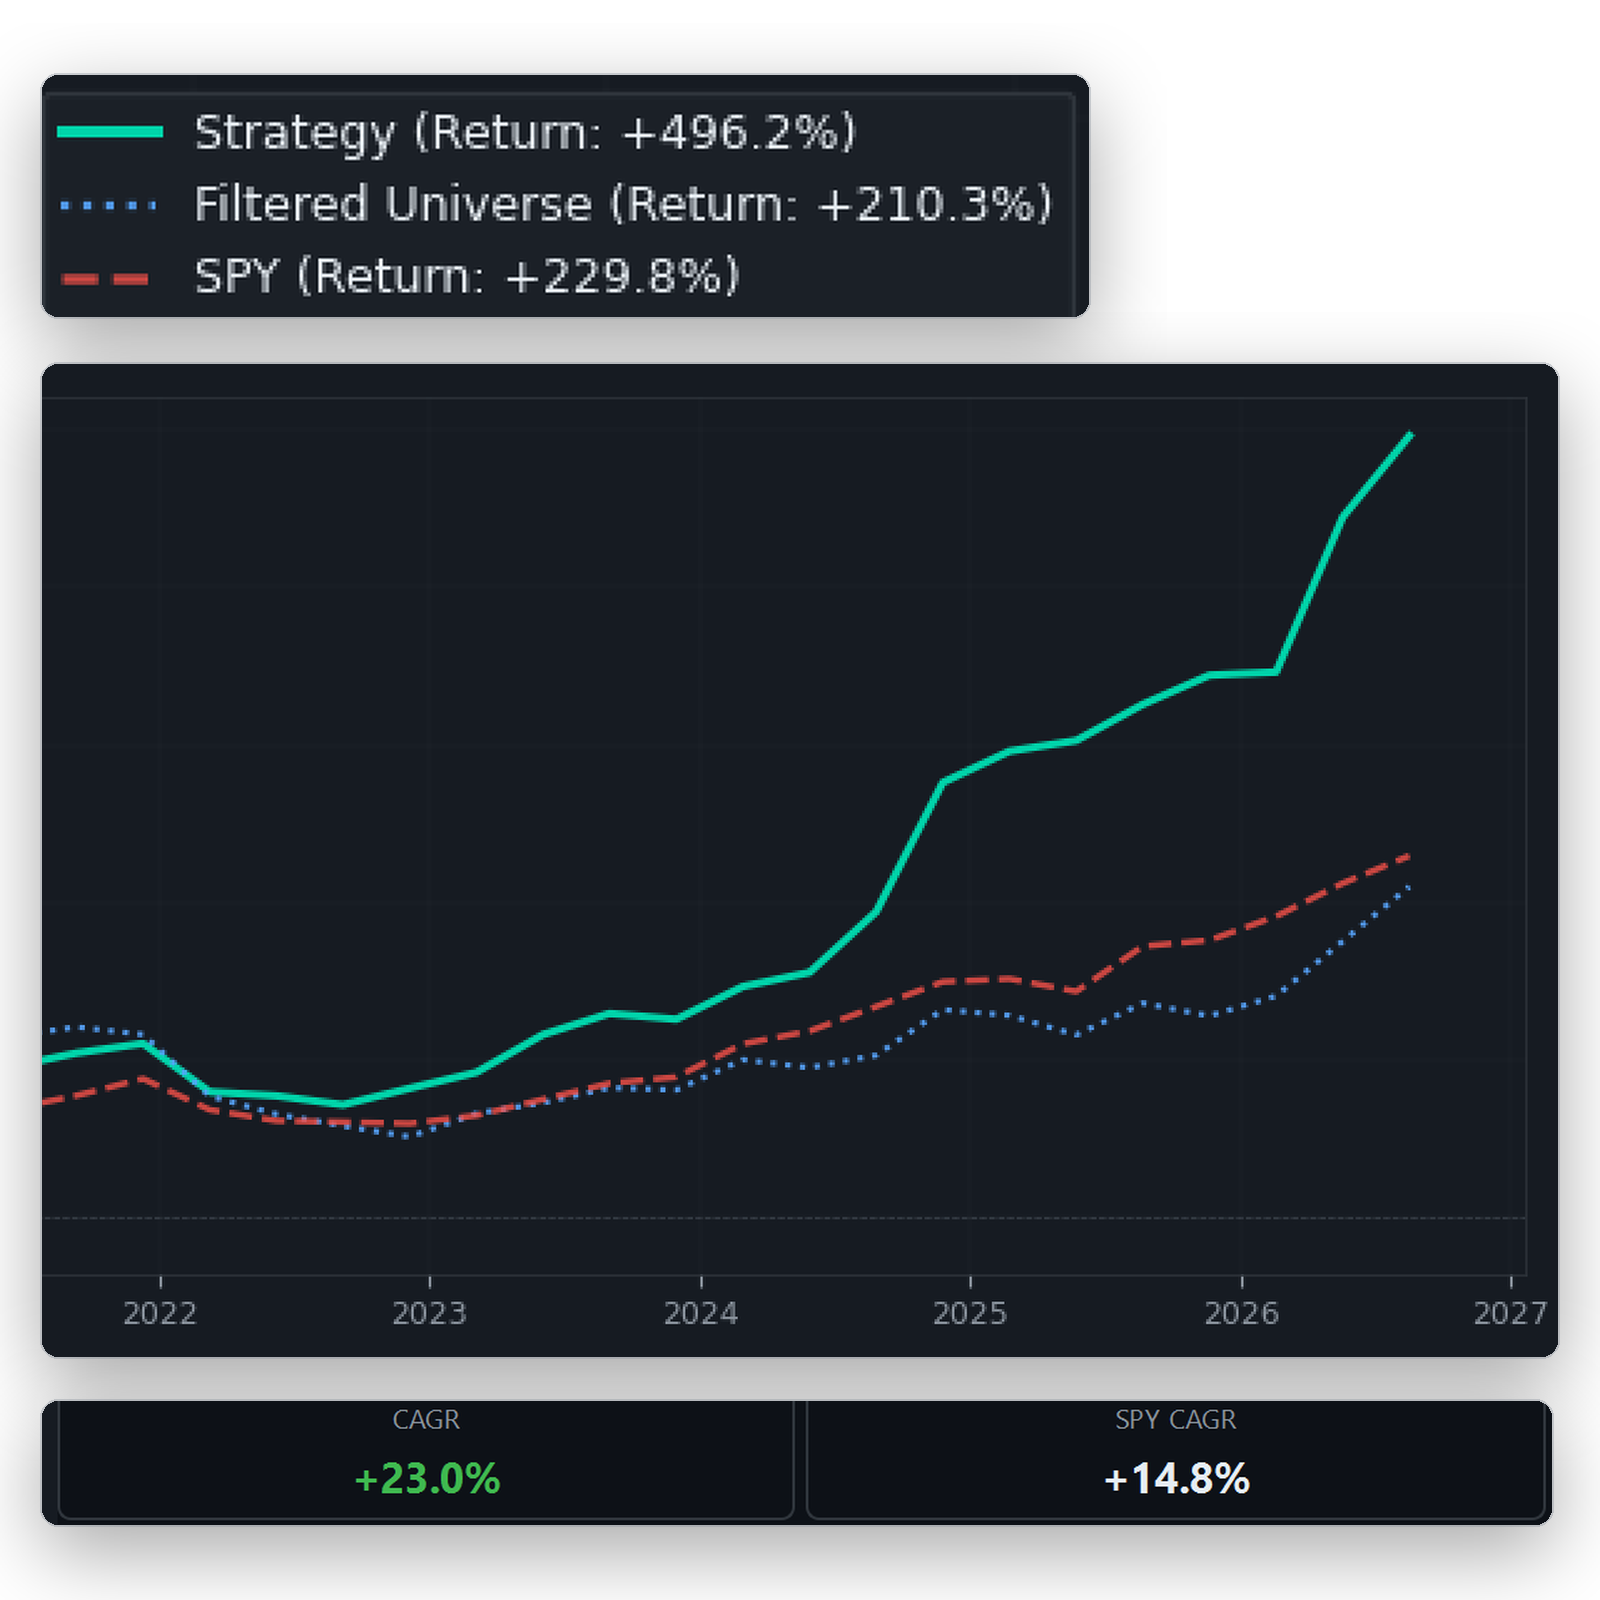
16 metrics—Sharpe, Sortino, Calmar, alpha, beta, max drawdown, win rate, and more. Benchmark and compare every backtest against the S&P 500.

Hypothetical backtested performance — not actual trading results. Backtests are calculated with the benefit of hindsight and do not guarantee future results.

LIVE

Portfolio & Trades

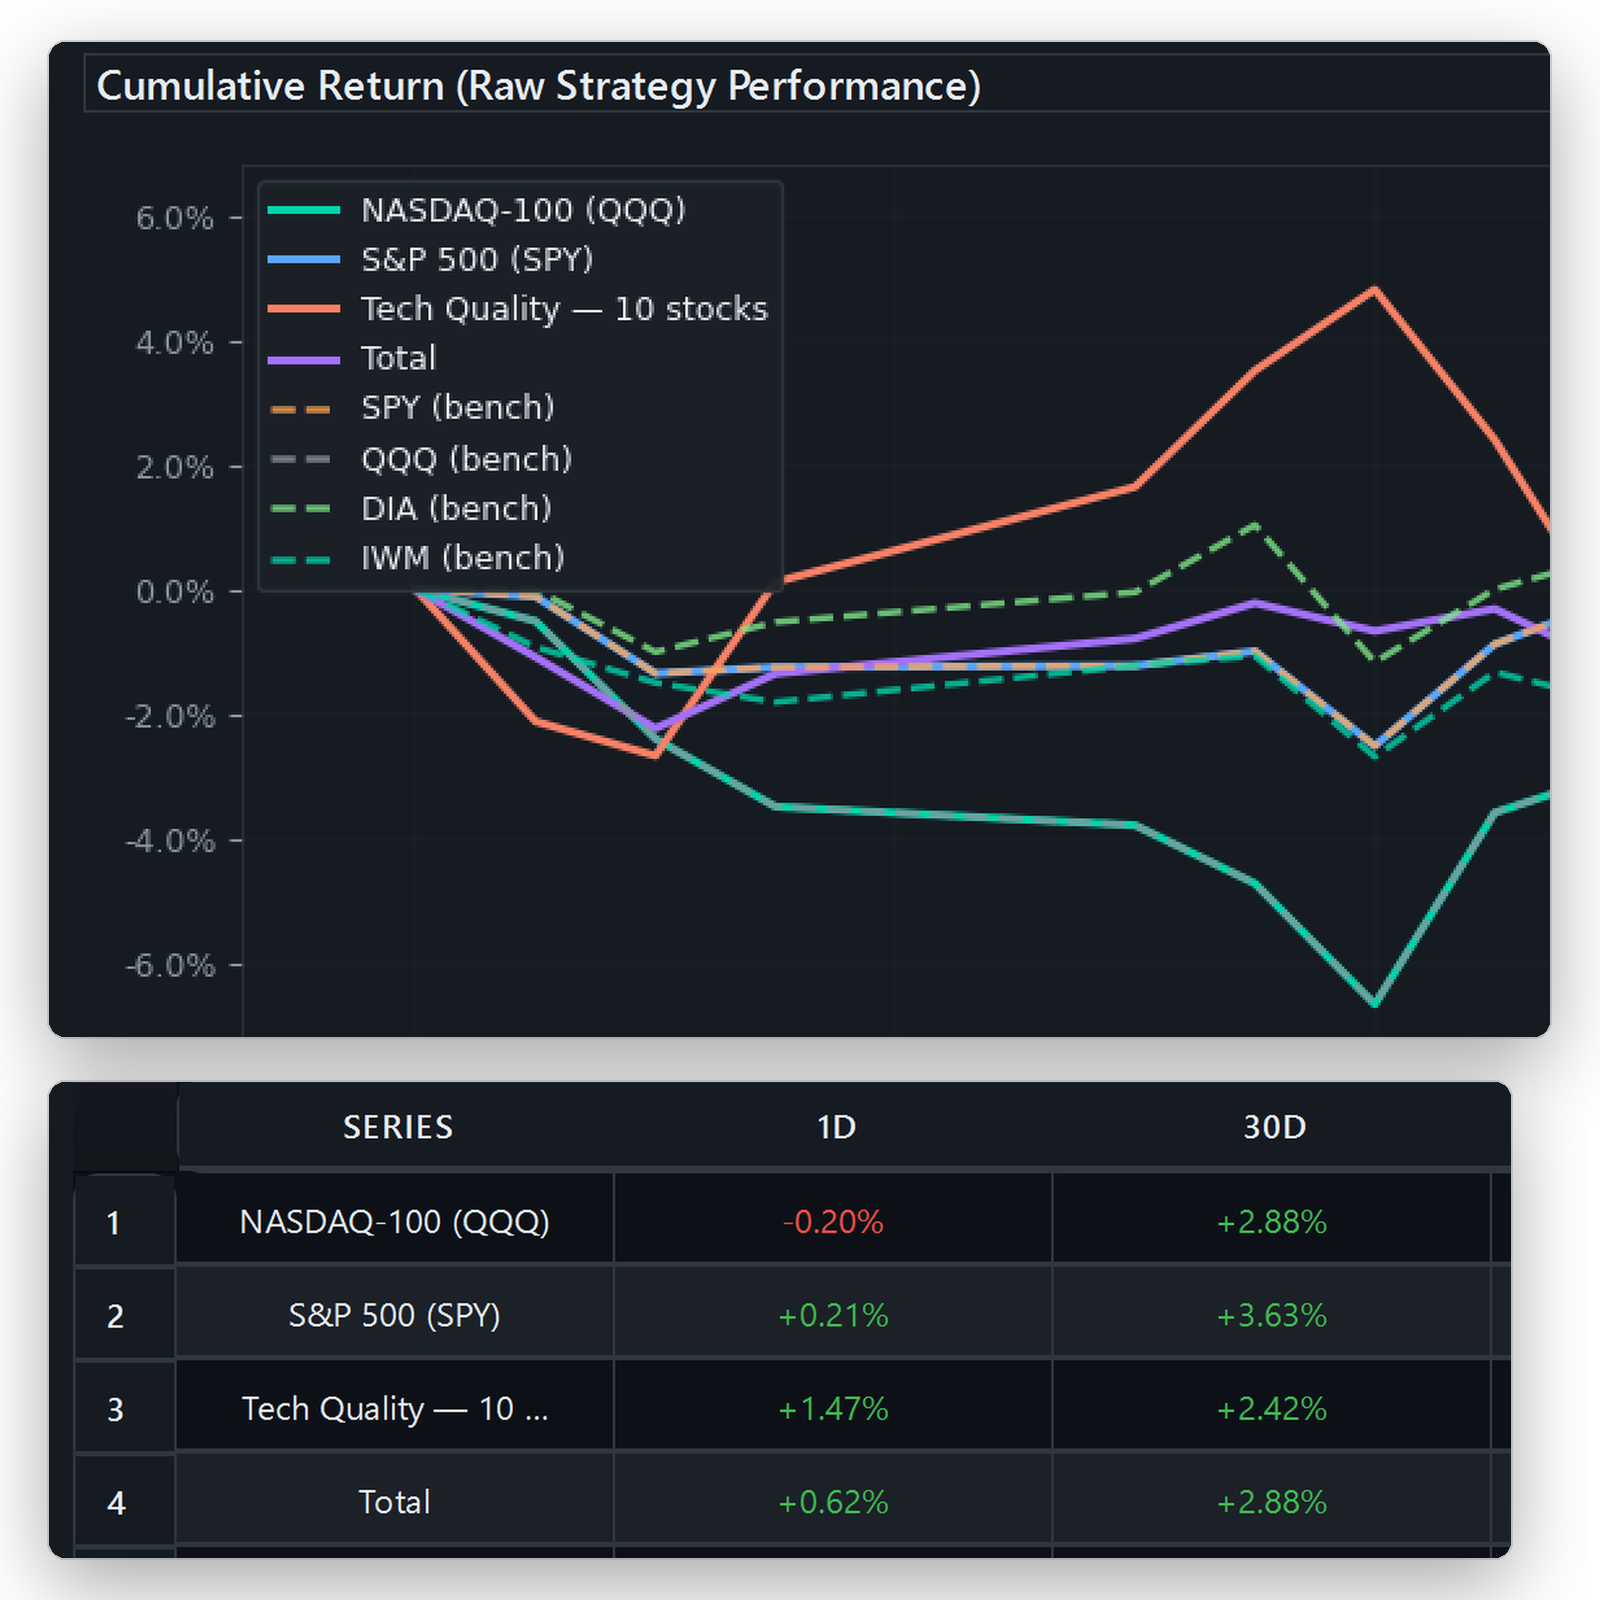
Live positions, lots, dividends, and tax events — straight from your Interactive Brokers account. P&L tracked by strategy, by lot, by realized vs. unrealized, with tax schedules built in.

Screenshot from a QuantAscent development account. Account values, positions, and returns are illustrative only. They do not represent a customer account, an actual investment result, or performance you should expect. Any securities shown are examples, not recommendations.
ANALYTICS

Performance Tracking

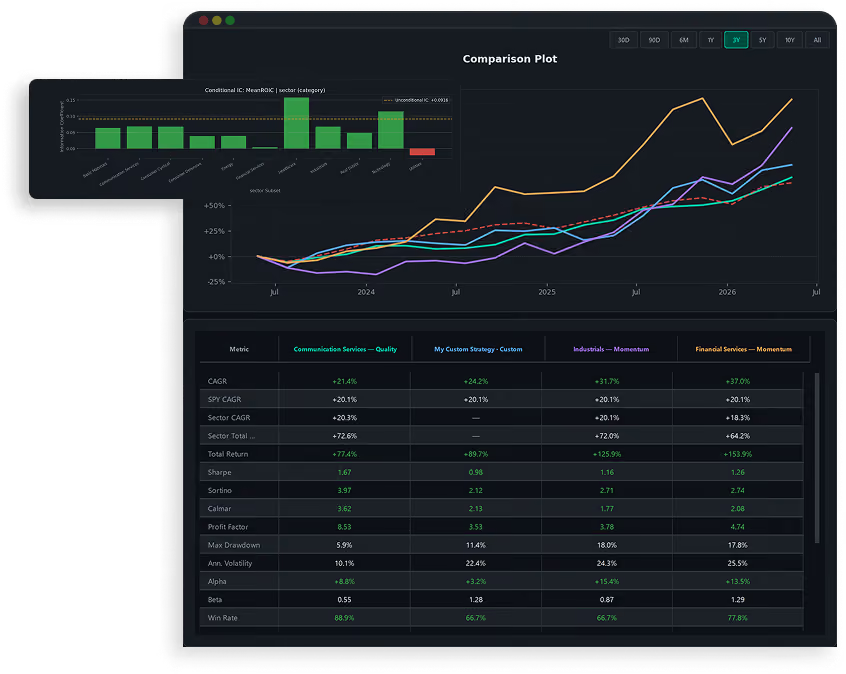
Compare real-world results against historical expectations. Monitor return, risk, and portfolio behavior to see whether your strategy is performing as intended.

Screenshot from a QuantAscent development account. Account values, positions, and returns are illustrative only. They do not represent a customer account, an actual investment result, or performance you should expect. Any securities shown are examples, not recommendations.

MORE THAN A STOCK SCANNER

Where the other tools end.

Where this begins.

Every category of investing software solves part of the problem well. The gap isn't in any single tool — it's in the connections between them. QuantAscent is built around those connections.

STOCK
SCREENERS

Finviz, Koyfin,
Simplywall.st

BACKTESTING
TOOLS

Portfolio123,
Quantopian

DATA
TERMINALS

Bloomberg,
Koyfin Pro

QUANT
FRAMEWORKS

Python / R,
custom stack

QUANTASCENT
PLATFORM

Connected
workflow

Factor research

Define, validate,
and compare factors
PARTIAL
Filter-based, no
factor attribution
PARTIAL
Built in, but limited
to strategy scope
PARTIAL
Rich data, no
structured workflow
FULL
Flexible, requires
significant build time
FULL
Structured factor
research environment

Strategy construction

Combine factors,
weighting, rules
NONE
Screening only,
no strategy layer
FULL
Core feature, but
isolated from research
NONE
Data only,
no construction tools
FULL
Fully custom,
high maintenance cost
FULL
Connected directly
to factor research

Historical testing

Backtest, attribution,
regime analysis
NONE
No historical
validation layer
FULL
Primary strength,
well supported
PARTIAL
Historical data yes,
testing framework no
FULL
Powerful but requires
custom build
FULL
Integrated with
strategy construction

Portfolio analysis

Live exposure,
drift, concentration
PARTIAL
Watchlists only,
no live tracking
PARTIAL
Simulated only,
not live portfolios
FULL
Strong, but
no strategy linkage
FULL
Custom built,
fragile over time
FULL
Tied to the strategy
that created it

Execution & iteration

Rebalancing, alerts,
systematic refinement
NONE
Manual process
required throughout
PARTIAL
Some automation,
limited to rebalancing
NONE
Data and alerts only,
no execution logic
FULL
Unlimited, but costly
to build and maintain
FULL
Closes the loop back
to research
FULL coverage
PARTIAL coverage
Not supported
MORE THAN A STOCK SCANNER
Where the other tools end.
Where this begins.
full partial none
Factor research
QuantAscentfull
Stock screenerspartial
Backtesting toolspartial
Data terminalspartial
Quant frameworksfull
Strategy construction
QuantAscentfull
Stock screenersnone
Backtesting toolsfull
Data terminalsnone
Quant frameworksfull
Historical testing
QuantAscentfull
Stock screenersnone
Backtesting toolsfull
Data terminalspartial
Quant frameworksfull
Portfolio analysis
QuantAscentfull
Stock screenerspartial
Backtesting toolspartial
Data terminalsfull
Quant frameworksfull
Automation & iteration
QuantAscentfull
Stock screenersnone
Backtesting toolspartial
Data terminalsnone
Quant frameworksfull
START THE LOOP

A system you understand, own, and iterate.

QuantAscent is built for investors who want more than a signal — they want a repeatable, research-backed process they can refine over time. Start with the platform, explore the tutorials, or read the documentation.

Start Free Trial

Hypothetical backtested performance — not actual trading results. Backtests are calculated with the benefit of hindsight and do not guarantee future results.

TUTORIALS

Learn the workflow before
you commit.

TUTORIAL 01

Introduction to Multi-Factor Investing

What factors are, why they work, and how to combine them into a coherent research framework.

12 min
Start Tutorial
TUTORIAL 02

Building Your First Strategy

Select factors, define weighting logic, set rebalancing rules, and run your first historical simulation.

12 min
Start Tutorial
TUTORIAL 03

Backtesting & Portfolio Construction

Interpret backtest results, analyze factor attribution, and refine portfolio construction for live use.

12 min
Start Tutorial

QuantAscent Technologies LLC is a software company. It is not a registered investment adviser, broker-dealer, or financial planner, and nothing on this site or in the application is investment, financial, legal, or tax advice, or a recommendation or solicitation to buy, sell, or hold any security. Strategies, screens, and built-in templates are analytical tools that you select, configure, and act on; they are not tailored to your financial situation, objectives, or risk tolerance. Performance figures shown on this site are hypothetical and backtested unless expressly labeled otherwise; they are not actual trading results and are not a guarantee or prediction of future performance. Investing involves risk, including the possible loss of principal. See our Disclosures, Terms of Service, and Privacy Policy.